This article appeared
on the Op-ed page of the Wall Street Journal December 14, 1981.
"The evidence suggests that each percentage
point drop in the inflation rate should send about $100 billion of the
tangible assets people hold back into the financial markets as increased
credit supplies."
It is now said that the federal deficit for fiscal 1982 will be roughly
$100 billion. This has sparked a furious debate between Wall Streeters,
who say such large government borrowing must push interest rates
higher, and supply-siders, who believe tax cut-induced increases in household
savings will more than offset rising government borrowing needs, and hence
must push interest rates power.
This fight represents a low of wasted ink. It reminds me of the scene
from the movie in which Frankie Avalon and Annette Funicello are frantically
trying to brush those pesky ants from their picnic blanket, when a creature
emerges from the surf in the background. Remember how we screamed ourselves
hoarse trying to warn them? "Look out, Frankie!" "Turn
around, Annette!" They just wouldn’t listen.
In my view the obsession with both Wall Streeters and supply-siders
with analyzing credit flows has led both to forget who the real
star is in the interest rate story.
Major changes in U.S. interest rates are usually caused by changes
in the way the public wants to hold its net worth. The point of this
article is that the drop in inflation in the last 18 months is forcing
households to restructure their wealth in a way that will force reductions
in interest rates n 1982, no matter what the level of savings or budget
deficits in the next year.
Flow-of-Funds Focus on Savings
Both sides of the debate use a flow-of-funds framework to forecast
interest rates. This framework views a financial market as a kind of
farmers’ market, where households bring their savings (credit supplies)
and governments and corporations bring their borrowing needs (credit
demands). Interest rates are the price that equates credit demands and
credit supplies. This is the source of the current fixation on deficits
and savings.
Wall Streeters fear that mega-deficits will piggyback the growing calendar
of corporate debt issues to explode credit demands. Savings won’t
be able to increase fast enough to meet these needs. After a brief dip,
due to the recession, short-term interest rates will climb to new highs
by late 1982. Long-term rates won’t budge from current levels because
institutional portfolio managers translate large budget deficits into
fear over rising future inflation.
Supply-siders believe the tax cut will increase the after-tax real
rate of return on investment income, inducing households to increase
savings. These increased savings, they argue, will provide more than
enough credit to satisfy government and corporate appetites for funds,
letting interest rates fall during 1982. And savings will continue to
grow, so exploding interest rates shouldn’t be a big problem through
the ’84 elections.
The debate, then, has largely degenerated into a doctrinal dispute
over the degree to which private savings will be stimulated by Mr. Reagan’s
tax cuts. To both groups, the key question is by how much and how quickly
personal savings will respond to changes in the after-tax real rate
of return.
Forced to choose between the Wall Street and supply-side views, I would
go with the supply-siders. There is ample evidence that households do
respond to change in relative prices – witness the phenomenal growth
of the money market funds (from $11 billion in 1978 to $150 billion
in 1981). Moreover the evidence, though not conclusive, bears some resemblance
to the supply-side view. Since Mr. Reagan took office, real after-tax
rates of return have stepped up households’ savings (i.e.,
they have stopped spending money). Since mid-August, interest rates
have fallen sharply.
In adopting the flow-of-funds framework of interest rate forecasting,
both sides neglect the fact that, in addition to owning stocks, bonds,
bank accounts, money market certificates and other financial assets,
households also owns condominiums, land, used cars, gold and countless
other tangible assets. This stock of existing goods, or tangible
assets, has been produced and stockpiled over many years, and in a real
sense represents the nation’s collected real wealth.
The stock of tangible assets in the U.S. is enormous. At today’s
prices the total stock of houses, cars, collectibles and other tangibles
is worth about $7 trillion. That’s more than twice the total value
of the goods and services the U.S. economy will produce this year.
I believe that failing to recognize the existence of the stocks
of tangible assets renders flow-of-funds analysis almost worthless
for forecasting interest rates.
To private investors, tangible assets are substitutes, or alternatives,
to financial assets. They ask: Should I buy a condominium or should
I put my money into a T-bill account? Should I sell some of y shares
of stocks to buy gold coins?
To consumers, tangible assets are substitutes for buying currently
produced goods and services. Should I buy a new car or is my current
car good enough for one more year? Since the amounts in question are
so huge -- $7 trillion – even a moderate sift in the way households
want to hold assets can have a huge effect on both credit markets and
durable goods sales.
The key to understanding the influence of tangible assets on interest
rates is the concept of "asset market equilibrium." An individual
is free to hold his wealth in any combination of assets he chooses.
One person with a net worth of $40,000, for example, may choose to hold
$20,000 in gold coins and $20,000 in currency. Another person, with
the same net worth, may choose to hold a $100,000 house, financed with
an $80,000 mortgage loan, $12,000 in furniture, automobile and personal
effects, and an $8,000 savings account.
Asset market equilibrium describes the state in which each and every
asset holder in the economy has gone through his own process of portfolio
selection, and now is holding the combination of assets which, at current
market prices, he finds most desirable.
What happens if people desire more condominiums than exist? Individuals
bidding for that scarce supply would drive the price higher, and the
attempted sale of bonds or other securities to fund the condo purchases
would tend to force securities prices down. These price changes tend
to lower the yield on condos as an investment and raise the yield on
bonds, causing people to reconsider their initial choices. Ultimately,
both condo and security prices settle at levels which, again, make people
content to hold the existing stock of assets.
This is not a new idea. James Tobin just received the Nobel Prize in
economics for developing the notion of portfolio balance. Mr. Tobin’s
idea was that the prices (interest rates) of financial assets will go
to whatever level will make investors just content to hold the available
stock of those assets. All we have done is to add tangible assets –
land and so forth – to the portfolio management problem faced by
every household.
This addition radically changes the nature of financial analysis and
interest rate forecasting. It breaks the link between savings and credit
supplies that plays such an important role in the flow-of-funds framework.
A household that owns at least some tangible assets can supply credit
in two distinct ways: 1) by increasing savings, i.e., buying securities,
with money out of its current income, or 2) by selling some portion
of its tangible asset holdings to buy bonds, stocks or T-bills. The
results are the same, increased credit supplies and lower interest rates.
Thus, a general increase in the public’s desire to hold financial
assets – a desire to exchange tangible assets for financial assets
– should be seen as an increase in credit supplies. Since the public’s
holdings of both tangible assets ($7 trillion) and financial assets
($7.3 trillion) are extremely large, a relatively minor change in their
desired stocks of assets can overwhelm savings and budget deficits in
its effect on interest rates.
In short, we should treat households as managers of portfolios of real
and financial assets. Their decisions about which assets to hold and
in what proportions to hold them will be based on the same criteria
as the decisions of the professional money managers; namely, expected
yield comparisons. The choice between tangible and financial assets
forces households to compare the expected yields on financial assets
-- roughly, interest rates – with the expected yield on owning
tangible assets. Often, the yield in tangible assets will include both
a stream of services – e.g., you get to live in your house –
as well as the potential for any increase in resale value of the asset
– because housing prices go up – during the time it’s
held. At this stage inflation enters the picture for determining interest
rates.
A sharp increase in inflation, for example, means an increase in the
yield on real assets relative to paper assets. Like any portfolio manager,
the people who run households are attracted to the high return on real
assets and try to increase their holdings of houses and durable goods,
using money obtained by selling securities. The result, upward pressure
on prices for houses and durable goods, and downward pressure on prices
for bonds and other securities, i.e., rising interest rates.
The following graph shows how people changed their holdings of tangible
assets as the inflation rate varied during the 1970’s.
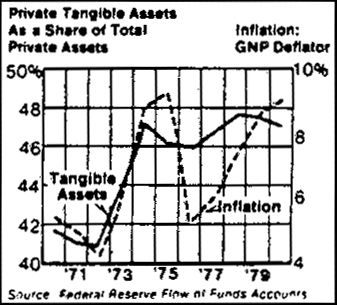
At the end of 1972, for example, the inflation rate was below 5%, and
about 41% of private sector assets were tangible assets: this implies
that financial assets made up about 59% of the assets of households
and businesses.
Within two years the inflation rate rose to nearly 10%. This increased
the yield of tangible assets relative to financial assets, so people
tried to cash in their stocks, bonds and bank accounts for money they
used to buy houses, gold and antiques. The result: a 6% shift of private
assets out of the financial markets and into tangible assets. That 6%,
roughly a $400 billion shift, caused a major drying-up of credit supplies.
Is it any wonder that interest rates soared in 1974? Rising interest
rates and rising prices for gold and real estate are not simply related
events; they reflect the same shift in household decisions about the
safest way to hold onto their accumulated wealth. And the thing that
sets off these decisions is inflation.
Turn the above analysis on its head and you’ll have the right
analysis for 1982. In the last 18 months, U.S. inflation has slowed
dramatically, undermining tangible asset yields. Residential real estate
prices across the country are falling. At the same time, T-bill rates
and other yields on financial assets have been at historic peaks. This
has opened a gap between paper and real asset yields that, to some of
the more aggressive inflation hedgers, looks like the Grand Canyon.
As some households make the inevitable shift away from tangibles and
back into higher-yielding paper, credit supplies will grow and interest
rates must fall.
We expect 1982 inflation to fall to 6%. This means a continued lackluster
performance for real asset yields. I am not saying that everyone who
is reading this will rush out and sell his house or buy a bond, or that
everyone in the U.S. will begin to think like a currency arbitrageur.
But the available evidence suggests that each percentage point drop
in the inflation rate should send about $100 billion of the tangible
assets that people hold back into the financial markets as increased
credit supplies.
Since the inflation rate for 1982 (6%) should be about four percentage
points lower than the 1981 figure, this suggests we’ll see an increase
in credit supplies of $400 to $500 billion for 1982 without counting
on a nickel of increased savings. If the administration’s tax cut
stimulates private savings by a significant amount, the case for lower
interest rates is stronger still. To my knowledge, no one has yet announced
that the deficit will hit one-half trillion dollars for 1982. If it
does not, interest rates must fall.
Postscript, April 27, 2000
To my delight, this article stimulated a spirited debate in the pages
of the Wall Street Journal. Art Laffer and Gary Shilling –
both very good friends today – wrote articles explaining why I
was wrong. I was invited to defend myself on the Op-ed page. The debate
continued in the WSJ, Barron’s, Forbes, Fortune,
the New York Times and the Financial Times during the
first half of the 1980’s. It was a career-building event
Irving Kristol started the whole thing in September 1981 at the bar—where
else would one think so expansively – of the New York Athletic
Club. I described the tangible asset analysis, which I had used to forecast
interest rates over the previous four years, to Irving on a bar napkin.
I offered it as a counter argument to the then-popular views of Dr.
Doom and Mr. Gloom that interest rates would head ever higher. Irving
said he thought it was an important idea that should be published in
the Wall Street Journal. He called Bob Bartley the same day. I owe both
of them my a large thank you. Twenty years later, Irving Kristol and
Bob Bartley, along with Charley Parker, the man who introduced me to
Irving and has been my best friend ever since, are the most intellectually
curious and intellectually honest men I have ever known.
Years later, Bob Bartley wrote a wonderful book called The Seven at
Years which reviewed the events surrounding the major policy decisions
of the 1980’s. In the book, Bob referred to this analysis with
very kind words.
As it turned out, the idea was a pretty good one too. Inflation has
declined from more than 10% to about 2% in most industrialized countries.
Households today hold less than 30% of their wealth in the form of tangible
assets, compared with nearly 50% in 1981. Interest rates have fallen
from above 15% to below 6%. Bond and equity holders have made 20 times
their money over the period. And if flow-of-funds analysis in forecasting
interest rates is dead today, I am happy to have played a role in killing
it.
Does the idea still work? For 20 years it provided a true North to
investors as the relentless disinflation drove rates lower and lower.
In the late 1990’s, the story got a new pair of legs from the technology
boom, which further undermined inflation. Today, although low inflation
still rules, the adjustments I described in this article—the forces
which drive interest rates lower -- are now complete. Other factors
have become more important. But don’t put the idea away. The next
time inflation heads higher, or lower, it will still help us understand
interest rates.
|
