Intrinsic Value Investing
A lot of people talk about intrinsic value investing.
After all, Warren Buffet does it, so it must be a good idea. In practice,
however, not many people actually do the work -- they just look for
cheap stocks based on relative price/earnings, price/book value, price/dividend,
or price/ (current) cash flow ratios. This makes intrinsic value fundamentalists
like us a little uncomfortable, like a Southern Baptist looking for
the Amen corner at a Unitarian convention.
When we say intrinsic value we mean it. To us it means valuing an
investment based strictly on estimates of its future free cash flow
stream and the investor’s after-tax cost of capital, just as if
the market were closed and he were going to own the investment forever.
It means basing those estimates on complete sets of projected financial
statements for the life of the business, the same way private equity
investors value an enterprise. And it means doing the work to understand
the market forces which determine the revenues, costs, profit margins,
capital intensity, capital structure and interest rates that ultimately
drive the evolution of those cash flows.
Ten years ago we started construction of a model that would estimate
the intrinsic value of equities based on the same analysis a permanent
owner would use. For the past five years we have used the model at Rutledge
Research to publish biweekly intrinsic value forecasts for institutional
investors. The forecasts cover the 10 major sectors of the US stock
market in order to identify sectors that are significantly overvalued
or undervalued. This piece shows some interesting current results which
indicate that technology, telecommunications, utilities, energy, and
utilities appear to be significantly mispriced today. We describe how
to use the forecasts, and give historical evidence on the model’s
five year forecast record.
Mr. Market and Mr. Momentum
The intrinsic value investor has two assistants to
help him make money, Mr. Market and Mr. Momentum. Mr. Market is the
wonderful fellow Benjamin Graham wrote about who shows up at your door
every day to give you a price at which he is happy to buy and another
price at which he would be happy to sell for every security in the market.
He is quiet and sober. Most days his prices are fair– he will
buy or sell a dollar of value for about one dollar -- which does not
interest the intrinsic value investor. He is also polite; he will keep
showing up every day even if you never do business with him. It’s
up to you.
Mr. Momentum is a different sort of guy. He tells you loudly what the
smart investors are doing, and advises you to do the same while you
still have time. When prices go up he advises you to buy more. When
they go down he wants you to sell.
From time to time Mr. Momentum gets Mr. Market intoxicated, which can
lead market prices far from their intrinsic values for long periods.
This is when the intrinsic value investor makes his money.
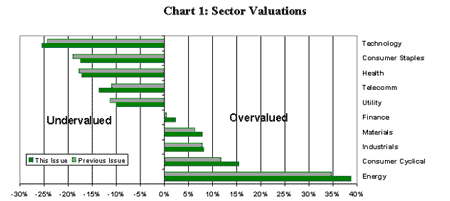
Today, as Chart 1 shows, Mr. Momentum has carried the prices of technology,
consumer staples, health care, and telecom stocks far below their intrinsic
values, i.e., you can buy a dollar of intrinsic value for as little
as 75 cents. In contrast, energy and consumer cyclical stocks are significantly
overvalued at today’s prices; you can sell a dollar of intrinsic
value to Mr. Market for $1.40. These prices represent a real opportunity
to improve the value of a portfolio by tilting the allocation away from
overvalued and toward undervalued sectors.
Value Drivers
Before we discuss how to use these forecasts let’s take a minute
to talk about how we produce them. We start with Compustat historical
data for the companies in the S&P 900 (the S&P 500 plus the
S&P 400 Midcap companies) using the S&P/Morgan Stanley GICS
sector definitions. We then construct a virtual company for the sector
by aggregating the financial statements of all the individual companies
in the sector.
We examine the historical data for each of the value drivers for that
sector over the previous 20 years to identify factors which can help
us forecast its future path.
Value drivers are the things you have to input in order to build a company’s
future financial statements. They include sales growth rates, cost of
goods sold margins, SG&A expense ratios, tax rates, capital spending
and depreciation rates, working capital and fixed assets per dollar
of sales, interest costs, capital structure, and many other variables.
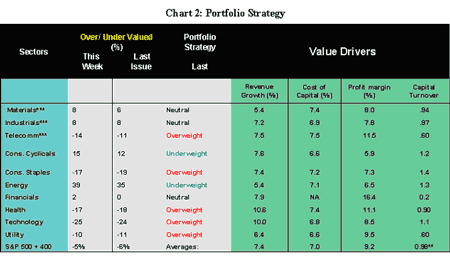
The Value Drivers we used to construct the intrinsic value estimates
in the Sector Valuation chart are shown in the table above.
We specify value driver paths for each year during the 30 year forecast
period and build a complete set of financial statements (P&L, Balance
Sheet, and Statement of Cash Flows) for thirty years into the future.
The present value of the free cash flow estimates from these statements
gives us the intrinsic value of the enterprise. Finally, we subtract
debt and divide by shares to get the intrinsic value of the sector’s
equity per share.
Zone Investing
Intrinsic value estimates give us a way to make judgments about when
a stock is too cheap or too expensive. In the charts below we plot the
percentage by which a sector’s stock price exceeds (overvalued)
or falls short of (undervalued) our intrinsic value estimate, using
actual prices and our published forecasts every two weeks over the past
five years. The red line shows the price one standard deviation above
intrinsic value; the blue line shows one standard deviation below intrinsic
value.
Although each sector has its own story to tell the charts show that,
in general, Mr. Market exhibits Tomcat stability. He wanders off from
time to time, sometimes a long way from home, and can be gone for months
at a time. But sooner or later he always comes home.
In this framework, the region bounded by the red line at the top and
the blue line at the bottom comprises a Value Zone in which prices are
too close to intrinsic value to call which way they are likely to go.
When prices are more than one standard deviation above intrinsic value,
however, it is a pretty god bet they will go down. Similarly, when prices
fall more than one standard deviation below intrinsic value they are
very likely to go up.
Based on these results there are several things we can say about the
current market:
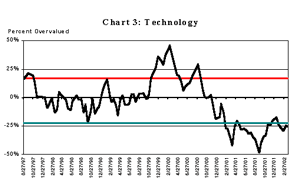
Technology stocks have been on a wild ride for the past three years,
first up, then down. As always happens, they trashed the good companies
too. Some companies today, e.g., Cisco, are selling far below intrinsic
value. We expect the rebound to happen at the point resellers have worked
through the unboxed inventory that was created by the bankruptcies of
the past year. At that point, anyone who wants a new router will actually
have to buy it from the company that produces it and margins will firm.
We see signs of that beginning to happen now.
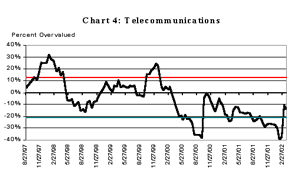
Telecom companies have also been oversold by investors
worried about both technology and accounting issues. Some of them, (Qwest,
SBC) have solid franchises, dependable cash flows, and growing dividends.
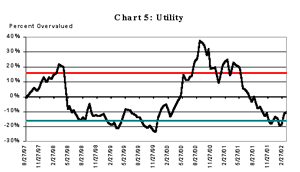
Everybody is worried about off-balance sheet liabilities today so they
have sold utilities to the point where they are too cheap. There are
solid dividend-paying companies in this sector for an investor who does
his homework.
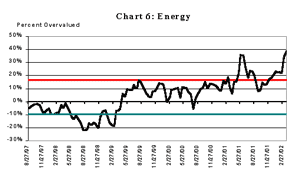
Energy companies are too expensive today. Investors are
worried that the war will spread to Iraq and that oil prices will jump.
Current prices for oil stocks only make sense if oil climbs to $30 per
barrel and stays there. That is not going to happen.

Even the dimmest bulb on Wall Street now realizes the
US recovery has already started. (You first heard about it here at Kudlow
& Company last November.) Investors have jumped on this story and
bid consumer cyclical stocks to unsustainable levels. They are going
to be disappointed.
Intrinsic Risk
Wall Street is crazy for betas, which equate a stock’s risk with
its volatility relative to the market over some previous period. We
think betas are nonsense. No serious investor worries about volatility;
they worry about losing their money. Intrinsic value points the way
a more meaningful way to measure and manage risk.
There are two fundamentally different types of risk. Market Risk is
the risk that you build a great business but no buyer will pay you a
fair price for it. As you can see in the charts, above, market risk
is important for short periods but not meaningful for a patient investor
who does his homework.
Intrinsic Risk is when your initial intrinsic value judgment is flat
wrong. You may have overestimated revenues or sales growth, underestimates
costs, failed to anticipate capital needs, or had too high an opinion
of the company’s franchise or management. The bottom line is it
fails to deliver the sustainable growing cash flow you had anticipated
in your intrinsic value estimate.
Intrinsic risk is much more important than market risk for investors.
With intrinsic risk time is not your friend and waiting won’t
make it go away. When investments die it is almost always intrinsic
risk that killed them.
It should be clear from this that intrinsic risk is the risk that the
set of value drivers we used to construct our intrinsic value estimate
do not follow our assumed paths. To assess intrinsic risk we need to
understand the statistical properties of our driver forecast errors.
We also need to understand how sensitive intrinsic value is to a given
error for each driver.
We will have a lot more to say about Intrinsic Risk in future issues.
For now suffice it to say that, for the overall market, three of the
value drivers stand out like gorillas among the others as sources of
intrinsic risk, sales growth, operating margins, and cost of capital.
All are influenced by the economy. Sales growth depends on real growth
and inflation. Operating margins are influenced by the overall economy.
Cost of capital is driven by interest rates.
At today’s low interest rates, cost of capital is King Kong. A
100 basis point increase in the ten year government bond yield would
lower the intrinsic value of the S&P 900 by more than 15%. Keep
a close eye on the economic forecast in the months ahead.
|

