In my piece last week
on Japanese deflation, I asserted that asset markets exert powerful
effects on the real, or production, economy-the one we use GDP to
measure-through the Junkyard Effect. This is where sharp declines
in secondary market prices undercut the sales efforts of primary
producers, causing a virtual shutdown in production. This article
describes the impact the junkyard effect has had on the technology
sector over the past year and why the recovery in revenues will
be sharper and quicker than most analysts believe.
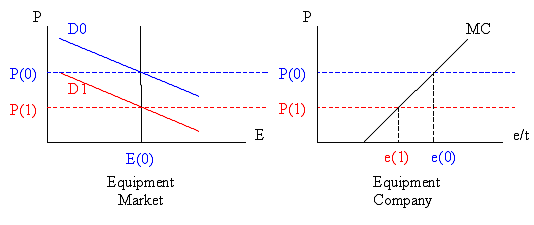
Property developers know what I mean by the junkyard effect. About once every decade the Federal Reserve floods the market with liquidity or there is a new tax bill, and the prices of existing buildings spike up relative to construction costs. For two to three years, they work around the clock to build new factories, hotels, and shopping centers. And about once every decade the Federal Reserve turns off the liquidity tap and the prices of existing properties collapse far below construction costs. And for two to three years, the developers can't get any work at all. The metals and other commodity markets go through the same feast or famine swing, as do the auto, appliance and furniture markets. What do all these markets have in common? They are all markets where there are many years of already-produced output sitting in stockpiles. Such markets behave more like asset markets than product markets. Producers have about as much control over where they go as a tick riding on a dog. Textbooks call it the business cycle, but there is nothing cyclical about it. It is caused by the interaction of the resale, or secondary markets-the junkyard-with the primary producers whose output we measure in GDP. In these industries when the junkyard is having a clearance sale, you might as well go to the beach. The only difference today is that the junkyard discounters have set up shop in the technology infrastructure and telecommunications equipment industries-the primary engines of US growth over the past decade. Thanks to the misguided telecom legislation in 1996, aggressive banks, an eager junk bond market, a cooperative Fed, and an army of day-traders, we experienced the phenomenal tech boom of the late 1990s. When the tide went out last year, the landscape was littered with bankrupt cable and telecom companies whose only recoverable assets were the routers, servers, and other IT equipment they had bought on the way up. The bang of the auctioneer's gavel was our first hint of the recession to come. Here's how it works. Chart 1 shows the economics of an industry that produces a product that lasts for more than one GDP period, i.e., one with a depreciation rate less than 100% per year. For the US, this would include all homes, factories, office buildings, capital goods, and consumer durable goods.
Chart 1

The left-hand chart depicts the asset (secondary) market. There is an existing stock of equipment, E(0), which is represented by an essentially vertical supply curve. Supply does not depend on price; it depends on history, because all the units that still exist must be owned by somebody regardless of price. This stockpile of existing equipment will grow over time as we produce new units of equipment (right-hand chart) and will shrink over time as the existing equipment depreciates at a rate equal to the inverse of the lifespan, or duration of the equipment. The demand to hold the existing equipment depends on price, as well as on other things, and slopes downward in the normal way. The inherited stockpile E(0) and initial demand D(0) result in asset market equilibrium at a secondary market price of P(0). The right-hand chart shows the economics of an individual producer of equipment, such as Cisco, Nortel, or Sun, in the technology equipment industry. Its horizontal axis measures the flow of production in new equipment units per year. The company increases production as long as the price at which it can sell the product exceeds the Marginal Cost of producing. At price P(0), the equipment maker produces and sells at a rate of e(0) units per year. This is the number that will be measured in the GDP accounts. I realize that depicting the demand for firm output as horizontal is stretching the analogy a bit. In the real world, each producer will have at least some control over its customers. But the main point, that there is a huge secondary market for the same products where customers can go if they find the price compelling, still holds. If there is a sudden, sharp drop in demand in the secondary markets-caused, for example, by a reduction in credit availability due to tight Fed policy-the secondary market price will fall to P(1). If the equipment maker is able to reduce its price quickly enough through the use of discounts, it will sell e(1) units at the new price P(1). If it does not have business practices in place that allow it to quickly change prices, however, and holds its price at P(0), it will not sell any product at all. Its customers can get all the product they want at the junk dealer. Both the decline in price and the decline in output contribute to lower revenues and a drop in measured GDP. Resale activity is not picked up in the GDP accounts at all. Most markets with large existing stockpiles of output have developed elaborate mechanisms to allow new product prices to quickly adapt to changing secondary market conditions or to reduce headcount through layoffs so factories can remain open during downturns. These include finance cost buy-downs in real estate, subsidized financing costs, trade-in allowances, and rebates in autos, and buy-now-pay-later plans in consumer durables. Relatively new industries, however, such as technology equipment, that have grown rapidly in the past decade have not yet had time to develop these mechanisms. They have born the brunt of the recent slowdown.
Chart 2: 2002 IT Equipment Sales

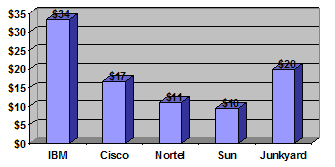
Chart 2 reproduces estimates (in billions of dollars) of 2002 IT equipment sales from a recent (February 4, 2002) Fortune article titled "Cisco's Worst Nightmare." The article described the tidal wave of "unboxed inventory" that is being sold in bankruptcy auctions this year for pennies on the dollar of original cost. The buyers are the more than 2000 resellers-junkyard dealers-who, in turn, sell the product to companies who would otherwise buy from original equipment makers. As the chart shows, this year the junkyards will have the #2 market share in the US, with devastating effects on profit margins for the industry in spite of aggressive efforts on the part of producers to shut the secondary market down. This $20 billion in sales alone is enough to reduce GDP by 20 basis points for the year without even considering the dampening effects on prices and margins at the primary producers. Every company that produces a durable product is competing more with its own used product than with its rival across town. In the case of autos, for example, there are more than ten used cars in driveways for every new car that will be produced this year. Computers, technology infrastructure, and telecom equipment makers are no different. But there is good news in this story, too. Watch out for the whipsaw effect when the secondary markets firm, as they always do. The Federal Reserve has been attempting to reflate the economy for more than a year now, with dramatic increases in the monetary base and reductions in interest rates. The economy is starting to grow. And, my own personal contacts at used equipment resellers are telling me they are starting to have stock-outs of selected products. When the junkyard doesn't have the router you need, you are going to have to buy it from Cisco again. When that happens, pricing will firm and we will see a sharp rebound in both sales and margins in the industry. I think a lot of analysts are going to be surprised by the performance of both the technology sector and the economy in the second half of 2002.
|

