One of our jobs is to be Bad Idea Cops,
letting you know when we find a particularly stinky piece of logic.
This weekend, we raided the New York hotel suite where the Democratic
leadership was holed up discussing budget policy. We arrested the whole
gang on charges of first degree felony bad analysis. If found guilty
by the voters, they could get life in the private sector.
First the facts. April tax collections came in low this year. Shockingly,
people who lose money in the stock market don’t pay capital gains
taxes. Capital losses, a war, and a recession, have combined to push
this year’s budget into deficit by $130-140 billion, the first
budget deficit in five years.
Next, the timing. The Treasury plans to sell $22 billion in five-year
notes on Tuesday and $11 billion in 10-year notes on Wednesday as part
of their quarterly auction. According to Bloomberg—the screen,
not the Mayor—some analysts are worried that “the weak state
of the government’s finances” shows that “borrowing
is set to soar” which will push Treasury prices down. This is
an excellent week to whine about the budget.
Finally, the rhetoric. Tom Daschle and Dick Gephardt are worried that
projected deficits will push interest rates up and drive the economy
back into recession. With straight faces they are telling us they want
to raise our tax rates to make the economy grow again.
As the Gipper used to say to Tip O’Neill, “There you go
again.”
There are two responses to their arguments: you got your numbers wrong,
and you got your logic wrong.
Response #1: You Got Your Numbers Wrong
Larry Kudlow and John Park handled the first point in their article
a few weeks ago, by exposing the reliance of the CBO’s out-year
budget estimates on overly-pessimistic growth forecasts. Deficits won’t
be big enough to be a problem, and could, with reasonable growth assumptions,
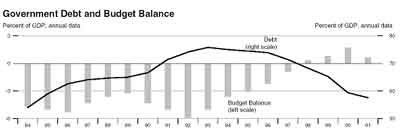
turn out to be surpluses that pay down the debt. As you can see in Chart
1, productivity-led growth has generated the tax revenues to pay down
the debt relative to GDP since 1993 and in absolute dollars since 1998.
There is no reason to expect it to stop now. The government’s
finances are not in a weak state. Borrowing is not set to soar.
Chart 1
The short-term numbers problem—this year’s deficit—was
caused by the Fed, not by low tax rates. Low GDP growth last year, due
to excessive tightening the year before and the credit crunch that still
plagues US companies, means low sales growth for businesses, low profits
for shareholders, layoffs, and low incomes for workers who still have
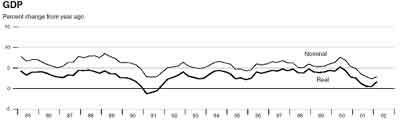
jobs. All undermine tax collections. If the Fed had not sucked 5% of
GDP growth out of the economy this year, as you can see in Chart 2,
we would have had the revenues to push the budget into surplus again.
Chart 2
Response # 2: You Got Your Logic Wrong. Deficits
do not determine interest rates.
Even if their numbers were right, however, their conclusions
would still be wrong. As a logical matter, it is debt, not deficits,
that determines interest rates. Throughout history, the correlation
between interest rates and deficits is actually negative. Here is why.
When the Treasury holds an auction to finance a deficit, they print
and sell new paper—this year $130-140 billion worth—into
the market. Investors already own a huge stock of similar old paper—$6006.0
billion at the end of March—which we call the national debt. At
the end of last year, there was $5943.4 billion of old debt outstanding,
of which $3393.8 billion, or 57.1%, was held by the public. Of that,
$2819.5 billion, or 47.4%, was held by private investors like you and
me.
New treasury paper and old treasury paper are perfect substitutes to
investors. In fact, they are indistinguishable in the market. When you
buy a bond, you choose its issuer, its maturity date, its call provisions,
its tax features, and its coupon yield, not its model year. This means
that new bonds and old bonds must sell at the same price. Arbitrageurs
make sure they do.
It’s like the Exxon commercial where the Dad asks his teenage
son to drive to the local gas station to put gas in the family car.
Hours later Dad was still standing in the driveway when his son returned
with the defense “But Dad, you didn’t want me to mix the
new gas with the old gas, did you?”
Bond investors mix the new bonds with the old bonds all the time.
The right question is what price it will take to make the investors
who owned the old paper yesterday still want to own the stock of new
and old paper tomorrow.
To answer this, let’s look at the balance sheets. American households
and nonprofit organizations owned $48.4 trillion worth of assets on
12/31/01. Of that, $16.3 trillion were tangible goods, including $13.3
trillion of real estate and $2.9 trillion of used cars, refrigerators,
and other durable goods.
They held $32.1 trillion as financial assets, including $5.0 trillion
of bank deposits, $1.9 trillion in money market assets, $12.9 trillion
in equity securities ($5.8 directly and $7.1 indirectly), $5.1 trillion
in non-corporate businesses, and $538 billion in US government securities.
Total household liabilities were $8.1 trillion, including $5.4 trillion
of mortgage debt and $1.7 trillion of consumer credit. Household leverage
was only 16.7% of total assets and 20.0% of their $40.3 trillion net
worth.
If we were to add corporate and non-corporate businesses, total assets
would rise to $72.8 trillion ($30.9 tangible and $41.9 financial) and
net worth would be $52.8 trillion. If we were to add farms, banks, and
state and local governments, total assets would easily exceed $100 trillion.
Please indulge me for a moment while I pick a bone. The Fed’s
Flow of Funds accounts reports the federal government as having $609.2
billion of assets and $4.2 trillion in liabilities, which implies a
negative $3.7 net worth. But they only report the government’s
financial assets, not their tangible asset holdings. This excludes all
those mail trucks you see on the highway, the tanks and airplanes owned
by the military, the federal office buildings and other structures,
and, according to the GAO, more than 750 million acres of land. At a
price of $5000 per acre, the value of the land alone would turn the
federal government into a net creditor!
A company in the private sector would be indicted for presenting its
accounts this way.
Against this backdrop, will the Treasury be able to sell an additional
$130-140 billion of new paper into a market that already owns $6 trillion
of identical paper?—of course it will. How much of a change in
bond prices, and therefore interest rates, would be required to entice
markets to accommodate that 2.1-2.3% increase in the stock of treasury
paper when they already own $3.4 trillion in federal securities and
$16 trillion in other debt obligations?—not very much. As Robert
Bartley wrote in his February 25 WSJ Opinion Journal article, “In
this ocean of money, interest rates can scarcely turn on a plus or minus
sign before $100 billion in the U.S. budget.”
Interest rates depend mainly on what is happening to net worth and on
the factors—mainly inflation and tax rates—that influence
the relative after-tax returns on bonds compared with other assets.
The rest is all rounding errors.
In asset markets, only demand matters. An existing stockpile that
must be held whatever the price means the supply curve is vertical.
Price, therefore the yield, or interest rate, is purely demand-determined.
This is the law of gravity for asset markets.
We can represent the demand for government debt (GD), as a proportion
of people’s net worth (NW), as a function of the expected relative,
after-tax returns on all assets (r), as shown in equation (1).
Equation (1)
GD/NW = g(r).
An investor must decide how much debt (leverage) to take on to increase
his portfolio of assets beyond his net worth, and how to slice his pie
of total assets into different pieces, based on the set of risk adjusted
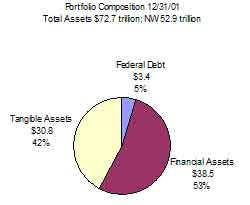
returns for different assets and liabilities. The composition of the
US portfolio as of 12/31/01 is shown in Chart 3. Federal debt comprised
5% or $3.4 trillion of total assets.
Chart 3
In equilibrium, the price of government debt i.e., the interest rate,
will be whatever it needs to be to make investors willing to hold the
existing stock of debt. This is true for each asset. All asset prices
are determined simultaneously because in equilibrium investors must
be content to hold all existing assets in their portfolios.
Asset Market Equilibrium Over Time
Asset equilibrium is a condition for one moment of time—a snapshot—not
a flow that we measure over a year, like we do with GDP.
As time moves on, however, asset stocks and net worth generally grow.
The stock of tangible assets grows as a result of building houses, factories,
shopping centers, and new cars faster than they wear out. The stock
of private financial assets increases as a result of issuing securities
to finance capital spending, home construction, or durable goods production
at a faster rate than old ones mature. We create new government securities
to finance the budget deficit, or destroy them by
using a budget surplus to buy back debt. Our net worth increases as
the stock of tangible assets grows over time due to these activities.
More net worth increases the demand for all assets in line with equation
(1).
Equation (2)
%GD = %NW + %g(r)
By re-arranging the terms in Equation (1) we can derive Equation (2),
which describes the evolution of government debt demand over time. Beginning
from an initial position of equilibrium, the quantity of government
debt demanded by investors will increase from one year to the next by
a percentage, (%GD), that equals the percent increase in net worth,
(%NW), plus (%g(r)), a term that represents the net effect of investors’
decision to re-slice the pie due to changes in relative after-tax returns.
In the case where there is no change in after-tax returns, demand grows
in proportion to increases in net worth.
We could represent this growth by drawing a second pie chart a year
later in which each section of the pie grows in size to reflect the
growth in assets in the underlying category. As an example, Chart 4
shows the projected composition of US portfolios for 12/31/02, assuming
that all asset categories, and therefore net worth, grow at 6.5% between
the two yearend dates. I have used 6.5% for illustration because the
most recent date show that the median home price has increased by 6.5%
over the last twelve months, and real estate is by far the largest component
of net worth.
Chart 4 shows a situation in which all domestic asset stocks have increased
by 6.5%, compared with their 12/31/01 levels. To do this we would have
to produce $2.0 trillion (net of economic depreciation) in new tangible
goods, sell $2.5 trillion in net new private securities, and increase
the government debt held by private investors by $221 billion. These
incremental amounts are represented in Chart 4 as the ring, or doughnut,
drawn around the original pie chart. In this regard it stands for the
new growth, exactly like the redwood tree example.
Chart 4
In this special case, I would expect asset prices
to remain unchanged, since all asset demands are growing at the rate
of asset supply growth in lock-step with rising asset demand. This includes
government debt.
But what would happen if one of the asset categories failed to grow
at the same rate as net worth? In other words, what would happen if
the supply for a particular asset failed to grow at the same rate as
the demand for that asset at constant asset prices? Simple—relative
asset prices would adjust to accommodate the new relative asset mix
so that asset market equilibrium holds at all times.
For example, if the budget deficit were
$140 billion, as now projected by the street, there would be a shortage
of government debt of $221 - $140 = $81 billion. This would put upward
pressure on government security prices—downward pressure on their
yields—relative to those of other assets until the spreads had
adjusted by just enough to make people content to hold the now relatively
smaller stock of government debt. This will be true as long as government
debt grows more slowly than net worth.
Let’s use the term neutral budget deficit to represent the budget
deficit that would neither push interest rates up nor push them down,
but just keep up with net worth growth. It is only to the extent that
budget deficits exceed the neutral budget deficit that they can be said
to push interest rates up at all.
We can argue about the right way to measure
net worth growth, and whether it will be 6.5% or 2.5% this year. But
one thing is clear. As long as net worth is growing, the neutral budget
deficit will be greater than zero. The balanced budget that we all wish
for would actually exert downward pressure on interest rates every year
if it were to happen. Over time, government debt would not become extinct
like the dodo bird; it would just become irrelevant to investors.
Net worth growth in the range of 4%-6% per year, as we would find in
a world of 2-3% real increases and 2-3% price inflation for tangible
goods implies neutral budget deficits of $136-$204 billion at today’s
debt levels. Projected budget deficits do not exceed these levels.
This analysis does not say that budget deficits are good or bad in a
normative sense. And it does not blunt the fact that higher deficits
caused by increased spending lead to incentive and resource allocation
problems. It just says they are unlikely to be a factor in determining
interest rates in the range we are likely to see them.
If deficits don’t determine interest rates then what does? The
answer is any factor that could drive a wedge between the relative returns
on different assets. Higher inflation does that by increasing the return
on tangible assets relative to securities, causing people to attempt
to sell securities to increase their holdings of real assets like we
saw during the 1970’s, which drives interest rates higher. Lower
income tax rates improve the after-tax returns on taxable securities
relative to real assets, for which income is generally not reported
or taxed. This will drive interest rates lower. Rising productivity
growth can quicken net worth growth which will drive interest rates
lower. And the Fed can influence the rate of net worth growth through
its asset market policies
Of course none of this is likely to change the rhetoric. Voters and
bond traders already have their beliefs: balanced budgets are good and
deficits are bad. This means there will be times in the coming months
when the Daschle’s and the Gephardt’s will convince them
we have a crisis. Don’t be surprised to see interest rates and
stock markets react negatively when this happens. But I plan to take
the other side of their bet every time this happens by buying into market
weakness. I suggest that you do too.
|
