|
In 1981 I was lucky enough to be part of the group
that produced the Reagan economic plan. At that time inflation was running
at 15 percent annually. The federal top marginal tax rate was 70 percent,
which had turned Americans into a nation of tax-shelter and inflation-hedging
experts rather than investors, entrepreneurs and workers. Instead of
buying financial assets—stocks, bonds, mutual funds—they
bought tangible assets like commodities, farmland and gold coins. Instead
of starting businesses, they developed shopping centers. Instead of
working, they borrowed to buy real estate they did not need. To accomplish
this they dumped financial assets, which drove down their prices and
left us with 20 percent short-term interest rates, 15 percent Treasury
yields and single-digit stock market multiples.
Twenty years later, all this has been turned on its head. Reagan’s
low inflation and low marginal tax rates undercut the after-tax return
on tax and inflation shelters and enhanced the return on securities.
In response, Americans shifted roughly $11 trillion out of tangible
assets and into stocks and bonds. For the past two decades, this $11
trillion arbitrage event affected every one of our economic lives. In
the face of such powerful forces of change, ordinary macroeconomic issues—budget
deficits, trade deficits, savings rates—have been simply brushed
aside.
Hard asset prices collapsed and financial asset prices soared. This
dramatic increase in the value of a dollar of future income manifested
itself in lower interest rates and higher valuation multiples. A $100,000
investment in the equivalent of 30-year zero coupon treasury bonds in
August 1981 would be worth over $2,000,000 today.
These asset-market events had important effects on the production economy,
too. Hard-asset deflation made the carrying costs of low-return real
assets too heavy for U.S. companies to bear. American industry embarked
on a decade-long ruthless restructuring wave that left them lean and
mean. At the same time, falling interest rates and rising stock multiples
reduced the after-tax cost of capital for American companies. The result
was a tsunami of investment and innovation that improved corporate efficiency
and lowered costs. Low tax rates created powerful work incentives.
Together, these factors returned the United States to its former position
as the world’s preeminent economic power. They also allow us to
predict the next great wave of change. Like its predecessor, what is
to come will be grounded in the same bedrock— the mathematics
of thermodynamics. Both Albert Einstein and Richard Feynman referred
to thermodynamics as the only physical laws that have never been broken—the
only laws they believed would hold for all time.
THROWING HEAT
Thermodynamics is the study of change—the transformation of matter
from one form into another. It is the physics of hot coffee cups and
cold ice cubes that we live with every day. It is the physics of systems
of particles. There is no thermodynamics of a single particle.
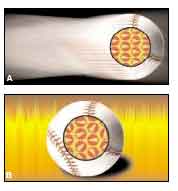
If a system of particles is moving in the same direction—the
baseball, on its way from Nolan Ryan’s hand to the catcher’s
mitt, in Chart A at right—we call it coherent energy, kinetic
motion or simply work. If a system of particles is moving chaotically,
jostling against each other but not going anywhere as a group—the
baseball in Chart B, which has been heated in an oven to 350 degrees—we
call it incoherent energy, thermal motion or just heat. The rate at
which its particles jostle against each other—the incoherence
of the system—is its temperature. The faster they vibrate, the
higher the temperature. Economics studies the interactions of systems
of people in markets. Just as in physics, our concerns are work and
heat—only we call them “output” and “cost.”
The particles of economic analysis—individual people— think,
scheme, love and hate. Otherwise, they behave just the same as the particles
in physics.
This framework gives us a simple way to think about economic policies.
The objective of economic activity is to transform energy into useful
work, the products and services we create to satisfy human wants and
needs. From this perspective we should measure Gross National Work,
not Gross National Product, which lumps in the market value of the “heat”
we generate—transaction costs and litigation expenses, for instance.
Excessive tax rates, subsidies to inefficient producers and trade restrictions
are examples of bad policies; they create heat and destroy work. Policies
that increase work are good policies. From this perspective, the proper
target for monetary policy is zero real asset inflation, i.e., zero
capital gains for the existing stock of tangible assets, into which
no further work—energy—is being invested. This would focus
investors’ attention on the underlying cash flows of an investment
and force wealth-creating energies into the security markets where they
can finance new capital formation. For central bankers, it means following
a price rule with stable land, property and commodity price values (see
“Follow the Money,” The American Spectator, Jan/Feb 2002).
Like physics, economics is a statistical science— our predictions
only hold on average. We rely on an idea called the Central Limit Theorem,
which says the average of a large number of strange things behaves in
a normal, more or less predictable way. And the spirit of Heisenberg’s
Uncertainty Principle holds for economics just as it does for physics:
We have no more ability to predict the behavior of one individual than
a physicist does of predicting the behavior of a single particle. That’s
why command economies—where dictators, demagogues or central planners
exert unusual influence— often degenerate into chaos.
The laws of thermodynamics state, among other things, that a temperature
differential cannot persist between two objects that are in contact
with each other. Their temperatures will tend to converge until they
reach the point of thermal equilibrium, at which the temperatures are
equal. Thermal equilibrium is the physicist’s definition of death—nothing
more happens. Anyone who puts hot French fries and a cold Coca-Cola
in the same bag learns this lesson the hard way.
For physicists, temperature differentials are an energy source—the
primary engine of change. Heat dispersion is what makes things happen.
An example is the storm fronts you see on the weather map—temperature
and atmospheric pressure differentials that lead to thunderstorms, tornadoes
and hurricanes. Similar forces cause volcanic eruptions, earthquakes
and everyday chemical reactions.
In the same way, we can track differentials in economics—storm
systems that sweep across the economy. Economists call this phenomenon
arbitrage. A price differential cannot persist between two identical
goods or services where buyers and sellers are in contact. In fact,
we use this idea to define the term “market”—a domain
within which prices tend toward equality. People buy low and sell high,
driving low prices up and high prices down until they are equal. As
they do so, they transform vast amounts of energy into work.

Arbitrage is what we all do every day. We arbitrage gasoline prices
between local gas stations. We arbitrage prices of bottles of shampoo
at the grocery store. We arbitrage waiting times when we choose which
line to stand in at the checkout counter. We arbitrage labor decisions,
savings decisions, investment and trade decisions, whether across town
or across the world.
There is, in fact, only one positive statement in all of economics:”
People arbitrage relative price differentials.” And that idea—
that people make choices to improve their wealth—is the essence
of supply-side economics. Just as with thermodynamics, the power of
supply-side analysis derives from its simplicity and its universal applicability.
The corollary is this: If an analysis cannot be reduced to a description
of people engaging in arbitrage activities, it is simply not economics.
Unfortunately, classical macroeconomics as it is usually taught and
practiced—focusing on mechanical rules to predict people’s
expenditures—fails this test.
UP FROM THE PHILLIPS CURVE
Classical macroeconomics teaches that governments can control the economy
by manipulating spending and tax rates. Students learn about the Phillips
Curve—a rhetorical smokescreen for politically driven tax, spending
and regulatory policies, which leads to the nonsensical conclusion that
the act of people working creates inflation. They learn that interest
rates are determined by the Federal Reserve, by budget deficits and
by flows of funds between savers and investors, rather than the portfolio
decisions of wealth holders. Worst of all, they learn that our collective
wealth and standard of living are determined by how much money we spend,
not by how hard we work, what we create, or how much we save and invest.
Macroeconomics textbooks typically begin by describing how to define
and measure economic activity on a hypothetical island economy. Some
people on the island catch fish, others pick coconuts. They exchange
fish and coconuts with each other (presumably so they get all two major
food groups). The island’s GDP is measured by adding together
the fish and coconuts produced in a year, using the market exchange
rate. Although in practice GDP is invariably measured by adding up people’s
spending, it is intended (and usually assumed) to be a measure of productive
work, much as we would measure the output of a business with a profit
and loss statement. Since both fish and coconuts are perishable–you
catch it, you eat it—GDP also equals total consumption for the
year. Saving and investment both equal zero. And there are no capital
markets—no assets—in the island economy. The perishable
nature of both fish and coconuts means it is not possible to produce
in one period and consume in the next.
Some writers, such as the great French economist Maurice Allais, have
introduced the idea of longer-term assets to the island by allowing
its inhabitants to write handshake IOUs, effectively saying,”
If you allow me to eat some of the fish and coconuts that you produce
this year, I will promise to allow you to eat some of the fish and coconuts
I produce next year.” In doing so, Allais showed that some demographic
patterns can result in a negative real interest rate. People near retirement
age, for example, have incentives to “save” by feeding young
people today who will, in turn, feed them later when they are too old
to work. If there are many people near retirement relative to young
workers, an old worker may have to pay a young worker two coconuts today
to get one coconut back in the future—a real (coconut) interest
rate of minus 50 percent.
The interesting questions of capital markets only arise, however, when
there are many assets, when real goods are storable and when people
are able to make choices among alternative ways to store wealth. I actually
live on the island of Maui, so I know something about island economies.There
are fish in the ocean in front of my house and coconuts in the back
yard, just like in the textbooks. When I go to sleep every night, however,
I don’t worry about the fish or the coconuts. I worry about the
volcano the island is sitting on. If it erupts during the night, tomorrow
is going to be a very bad day.
The $10-trillion-a-year U.S. economy sits on top of a volcano, too—our
$100 trillion balance sheet. Even small disturbances in such a huge
base of assets can make waves—thermal disequilibrium, in physics
terms—so large that they swamp the effects of the changes in spending,
savings, budget deficits and other “flow” measures that
macroeconomics concerns itself with. These tidal waves of change are
transmitted to people’s lives through changes in asset prices.
WHERE’S HAMLET?
In the late 1970s, Jimmy Carter was president. Inflation, tax rates,
government spending and interest rates were all rising, growth was stagnant
and the dollar was dropping like a brick. Real estate and commodities
were soaring. The stock and bond markets were a mess.
Accepted wisdom then was that inflation did not matter much for the
real economy. After all, labor and product contracts could be indexed;
interest rates would rise by just enough to compensate savers for their
expected loss of purchasing power—a view mistakenly attributed
to the great economist Irving Fisher—leaving real interest rates
unchanged. Fisher—like Knut Wicksell, John Maynard Keynes and
Eugen von Boehm-Bawerk—understood the lessons of the periodic
deflations and financial panics that had plagued Western countries through
the 1930s. Monetary, credit and tax disturbances have major effects
on both real interest rates and on real economic activity.
Accepted wisdom was not doing a very good job explaining the 1970s.
About that time, I found an extraordinary set of data that reported
the market value of people’s holdings of tangible assets—land,
houses, capital goods, consumer durables and commodities. The numbers
were huge, bigger than anything macroeconomists were writing about.
What intrigued me most was that macroeconomics had no analytical pigeon
hole for this data. In a flow chart contained in his 1969 presidential
address to the American Economic Association, James Tobin of Yale identified
“the interest rate” as a parameter set by the central bank.
Asset arbitrage— which students of Tobin’s later had the
hubris to call “Modern Portfolio Theory”—was confined
to security markets. Interest rates influenced the production economy
through their effects on investment decisions, but the real economy
did not in turn influence interest rates. Real assets, at least as far
as the model was concerned, did not exist.
How could that be, I wondered? Interest rates were simply prices of
a particular subset of people’s assets. The largest asset class
was real estate, not securities. Didn’t this leave out the star
of the play? It sounded like the joke going around about the U.S. government’s
refusal to recognize the one billion people in China: How could we ignore
our biggest asset?
My colleagues and I at the Claremont Economics Institute built what
we called the asset market shift framework, to give Hamlet back his
speaking part. We used it to great profit during the latter stages of
the Carter inflation, to predict the effects of rising inflation and
tax rates on interest rates and commodity markets. This framework unified
the behavior of the hard asset markets with the security markets and
explained why variations in inflation and tax rates exert powerful real
effects on interest rates, asset values and real wealth accumulation.
We used it later as a theoretical framework for the Reagan economic
plan, which critics dubbed the “Rosy Scenario.” Twenty-two
years later, rosy looks pretty good.
In November 1981, I wrote a piece describing this idea for The Wall
Street Journal’s op-ed page, titled “Why
Interest Rates Must Fall in 1982.”(pdf
file format) At that time, Wall Street economists were divided between
those who, like Dr. Doom—Henry Kaufman of Salomon Brothers, believed
Reagan’s tax cuts would lead to big budget deficits and rising
interest rates—and those who argued that Reagan’s tax cuts
would stimulate more savings and drive interest rates down.
I argued that the course of interest rates would not turn on either
savings or deficits. Instead, the Reagan Administration’s economic
plan was going to turn the asset markets on their head by forcing massive
private sector arbitrage. And this in turn would reverse all the major
trends of the 1970s. Interest rates would fall, regardless of the budget
deficit. Deficits and savings rates would be rounding errors, in the
biggest portfolio event of the century.
I didn’t get many dinner invitations from fellow economists after
that. But I did make a lot of money.
POWER TOOLS
As economists, we have two theories about prices in our tool box. The
first—supply and demand—is the price theory of Alfred Marshall
and George Stigler. It works well for haircuts, guitar lessons and other
perishable goods and services— things with a high rate of current
production and small existing stockpiles. The second—portfolio
theory—was worked out by Irving Fisher, Knut Wicksell, John Maynard
Keynes, Milton Friedman and James Tobin. It works for long-lasting goods—Rembrandts
(he’s not painting any more), ’57 Chevys (the best car ever
made, pronounced with a hard ch, as in Cheech and Chong,) and beachfront
property (they aren’t making any more).
To get the right answers, you need to use the right tool. To find that
in this case, we can use a parameter I will call alpha, calculated by
dividing the existing stockpile by a year’s production. Most products
are somewhat storable but wear out over time. They have alphas larger
than haircuts and smaller than Rembrandts. Medical services, food and
apparel all have alphas close to zero. As far as pricing goes, they
behave like services. Land, homes, copper, gold, even automobiles (there
are 150 million used cars in the United States, about 10 years’
production) will have alphas between 15 (for cars) and infinity (for
land). Hard assets, in other words.
Bonds may seem ephemeral, but their prices behave like Maui beachfront.
On March 31, 2002, the total existing stockpile of government debt—the
national debt—was $6.01 trillion. Of that total, $3.39 trillion
was held by the public; the rest was owned by government agencies. By
contrast, this year’s federal budget deficit will be about $130
billion, i.e., the federal government will produce and sell $130 billion
of new debt. Using these numbers, we can calculate the alpha for government
debt as either 46.2 or 26.2, depending on which measurement of ownership
you prefer to use in the numerator. Either way, the outstanding stock
of government bonds is many years’ new supply.
What this means is that the supply of bonds will be almost invariant
to price— the supply curve is effectively vertical. Put another
way, bond prices—and therefore interest rates—on any given
day will be insensitive to government financing activities. Interest
rates are determined by demand; they will be whatever they need to be
to make people willingly hold the existing stock of bonds. The mechanism
that makes this work is portfolio balance—the asset market analog
of thermodynamic adjustment.
The U.S. asset markets are huge. At the end of last year, the three
sectors reported by the Federal Reserve Board—households and nonprofit
organizations, corporations and noncorporate business— held a
total of $72.9 trillion, equal to 9.8 times our annual disposable income.
Tangible assets stood at $30.7 trillion, including $22.9 trillion in
real estate, $3.9 trillion in capital equipment, $2.9 trillion in used
cars and washing machines, and $1.3 trillion of inventory. The remaining
$42.3 trillion—58 percent of the total— was financial assets.
Factoring out businesses shifts the balance slightly. Households and
nonprofit organizations alone owned $47.9 trillion of total assets at
the end of 2001, split almost exactly one-third/two-thirds between hard
and financial assets. Liabilities totaled $8.1 trillion, just under
17 percent of total assets—not much leverage, in spite of what
you read. Household net worth was a whopping $39.9 trillion.
So much for the facts. Portfolio balance, to use our physics terms—asset
market equilibrium— refers to the situation in which returns on
tangible and financial assets are exactly equal. In other words, there
are no arbitrage opportunities—no price differentials— for
investors to exploit. But anything that materially alters the relative
risks or returns of the two asset classes will tilt the scale, leading
investors to adjust their portfolios to seek a higher return. Prices
change until investors are again content to own the existing assets—until
equilibrium is restored.
Hence the importance of splitting the national balance sheet into hard
versus financial assets—inflation and tax rates affect their returns
so differently. Inflation makes a positive, direct contribution to the
total return on tangible assets in the form of capital gains, and investors
will shift their portfolios in response. Doing so drives tangible asset
prices up and financial asset prices down—i.e., interest rates
up—until equilibrium is restored. Similarly, an increase in tax
rates reduces the relative after-tax return of financial assets, since
the yield on tangible assets is generally nontaxable. This will shift
demand toward tangible assets, drive their prices up and financial asset
prices down, until balance is once again restored.
Irving Fisher wrote about all this more than a century ago, when he
examined the link between inflation and interest rates— real interest
rates. John Maynard Keynes understood it as well: Chapter 17 of his
General Theory is the most cogent description of asset arbitrage ever
written. Asset arbitrage explains why real asset prices should be used
to benchmark inflation, not consumer prices or GDP deflators, because
the spread between tangible and financial asset yields is the key driver
of investor behavior. Measured properly, this tangible real rate is
the economic analog to the temperature differential that serves as the
fundamental energy source in thermodynamics.
Now back to the real world. During the past 20 years, American households—
responding to low inflation and tax rates— have systematically
reduced their tangible asset holdings as a percentage of total assets,
from 43 percent in 1981 to 32 percent today (see chart above). This
has pushed interest rates to their lowest point in 40 years and stock
price multiples to historic highs. It has also played havoc with the
economics of durable goods industries, which have been forced to compete
with mountains of their own previously produced products selling at
continuously discounted prices.
Home prices are a perfect example. A benchmark of U.S. stocks as measured
by the S&P 500 Index was valued at two median homes during most
of the 1980s.The ratio increased to four homes in 1996, and peaked at
more than eight homes during the dotcom boom in late 1999, before falling
to about six homes today. Throughout this period, home builders, commodity
producers and durable goods manufacturers faced a powerful headwind,
leading to margin pressure and continual fixed-asset write-offs. Owners
and producers of financial assets, in contrast—stock market investors,
brokerage firms and mutual funds—enjoyed easy profits. Schools,
guidance counselors and graduating students followed the gradient leading
to the greatest wealth. We went from being a nation of real estate brokers
to a nation of stockbrokers in one generation.
DISEQUILIBRIUM
There is a dirty little secret in all this. Economists know a lot about
what things look like in equilibrium, when nothing that matters is happening.
We know almost nothing about what happens in disequilibrium, when the
real money is made or lost.
The same thing is true in physics, but physicists are more honest about
it. Thermodynamics textbooks always confess that the formulas only work
for reversible processes— those that change in such infinitesimally
small increments that they can be viewed as if they are effectively
in equilibrium at all times. Irreversible processes, by contrast, tend
not to have well-defined paths. Think of the explosion of an atomic
bomb.
Economists deal with this problem in the natural way: We assume it
away. One way is to assume that there is an imaginary auctioneer—
the tiny homunculus of philosophy— who calls out hypothetical
prices until he finds a price at which supply and demand balance. Then,
and only then, do transactions occur. Alternatively, we assume that
price change is determined by an arbitrary rule—for instance that
prices will change in proportion to excess demand, a notion that has
dominated economics discussions since Paul Samuelson’s Foundations
of Economic Analysis, published more than 50 years ago This rule has
the virtues of implying that a price in equilibrium will remain there,
since excess demand is zero. And it makes a certain amount of sense
if we view excess demand as a stimulus.
But thermodynamics tells us a different story. Ludwig Boltzmann, a
19th-century German scientist and the true father of the field, developed
an equation—Boltzmann’s Probability, also known as Boltzmann’s
Distribution— that we can use without revision to explain the
speed of price change in disequilibrium. Its key is the understanding
that, in formal terms, all chemical reactions are cooling processes.
And chemical change, like all other physical processes, happens through
discrete events in which molecules form and re-form bonds to move to
lower energy states, under the direction of the law of entropy.
As it turns out, only two factors determine the speed of a chemical
reaction. The first is temperature. In asset markets, this would be
measured as the difference in relative returns for different assets,
which provides the incentive for a market participant to engage in arbitrage
behavior. The greater the difference, the more energy—incentive—
there is for change.
The second is a minimum energy requirement— the threshold required
to break an existing bond. In economics, this would be the brokerage
commission or other transactions cost, which must be exceeded before
arbitrage becomes worthwhile. This threshold factor makes economic change
lumpy—just like quantum physics—and leads to the conclusion
that economics, like physics, is inherently a statistical science.
In 1972 I wrote a book called A Monetarist Model of Inflationary Expectations,
in which I made a formal study of the information market. My conclusion
was that economies of scale in information processing would eventually
drive transactions costs to zero, making rapid price change inevitable.
Transactions costs have since fallen by more than 90 percent—in
Boltzmann’s language, they can no longer be counted on to serve
as an effective buffer on the speed of price changes. This has some
very obvious implications: Price disequilibria—markets, in other
words— will be more erratic and volatile. Historical volatility
estimates will consistently underestimate future volatility. And options
will consistently underprice risk.
A GLEANER’S MARKET
Asset market disturbances, like a change in the inflation rate or a
change in the capital gains tax rate, are one-trick ponies. Like hurricanes,
they stir a lot of things up and can change some things permanently,
but when they are over, they are over. For good or ill, the hurricane
created by the post-Reagan disinflation is over now. Balance sheets
have now fully adjusted to today’s inflation and tax rates. This
leaves us with two things to do—clean up the mess and start watching
out for the next dislocation.
There is still plenty of cleaning up to do. Most of it takes the form
of squeezing the hubris out of the people who got the erroneous impression
that it was their efforts, rather than a rising tide of price change,
that made them rich. Day traders and momentum investors are one such
group. The managers of Enron, TYCO International, Global Crossing and
others who found accounting rules too confining are another. Dot-com
bingers, venture capital investors, pension fund managers, conflicted
analysts and investment bankers are a third. Unfortunately, the clean-up
will also spawn witch hunts, like the one playing out on C-SPAN every
day. The final mess we have to clean up is inside our heads. We all
have to learn that the incredible Reagan Run of the last 20 years is
over. From now on we are going to have to actually earn the money.
Bummer.
For two decades, the biggest mistake an investor could make was to
be out of the market. We made our money by betting on rising valuations,
not rising company performance. Momentum investing worked; value investing
didn’t. Stocks in the S&P 500 made money; small caps didn’t.
An entire generation of investment professionals— four out of
every five people now working on Wall Street—was hired fresh out
of school and trained during this period. A bull market—Wall Street’s
self-important term for this massive asset shift—is all they have
ever seen.
Barely two years later, we face a very different world. Real growth
of between 3 and 4 percent a year, due to strong productivity gains,
is great. But inflation between 1 and 2 percent annually means that
nominal GDP growth—and therefore revenue growth for most businesses—will
average as little as 4 percent. That implies single-digit earnings growth
and single-digit stock market returns. The winners will be companies
that are able to demonstrate consistently above average top line growth,
systematic cost reductions and pricing power. Identifying them is the
work of old-fashioned, bottom up, value-oriented security analysis.
There aren’t many people around today who remember how to do that.
The asset market shifts we experience in the next decade will be different,
too. Instead of the wholesale repricing of the entire balance sheet,
we will be in a gleaner’s market— smaller, shorter-lived
and more geographically dispersed opportunities. Barring some new, huge
outside event, this is a market where hedge funds will have a distinct
advantage over larger, slower-moving, long only mutual funds. The troubles
we have been seeing with the big Wall Street institutions in recent
months may be a harbinger.
These mini-shifts will be like small storm systems—not important
enough to make the 10 o’clock news, but big enough to shake things
up for the local residents. Typically, they will occur in situations
where disequilibrium happens in an area below the horizon of the usual
analyst’s radar.
One example is the utility and energy trading sector—the eye
of the witch-hunt hurricane. Investors are selling good franchises along
with bad ones. Value investors who know the difference will be rewarded
handsomely once the witch-hunt is over.
A second example is Japan. The economists at the Bank of Japan think
they have been stimulating the Japanese economy for more than a decade
with budget deficits and low money interest rates. While they have been
talking stimulus, they have been walking tight money. Land and other
real asset prices in Japan have been deflating for more than a decade.
Tangible real interest rates have hit 10 percent.
Japanese companies—long fixed assets and short yen debt—
have been crushed under the burden of never-ending write-offs, leading
to a series of recessions. Their problems cannot be resolved until land
prices stop falling. Recently, money growth has exploded and the yen
is falling. If this signals a reversal in the decade-long deflation,
it will be a great opportunity for investors.
A third example is Germany, where capital gains tax rates on cross-shareholdings
were reduced to zero earlier this year for public companies. Although
political and labor market problems will keep the German economy from
growing rapidly, the tax law changes will push a wave of restructuring,
making merger arbitrage yet another interesting area. In the U.K., too,
pressure to devalue the pound before joining the European Monetary Union
will undermine the return on some industrial assets and fan the fires
of property inflation—already 16.5 percent last year.
There is no shortage of portfolio disturbances elsewhere. Korea is
going gangbusters, raising the return across the board on Korean assets.
Asian economies are recovering. Latin America is morally, politically
and economically bankrupt. U.S. restrictions on steel imports pushed
up flat-rolled steel prices by as much as 50 percent in a month, leading
to a 50 percent increase in the market capitalization of specialty producers
like Timken. Restrictions on lumber have added $1,000 to the cost of
building a U.S. home. Europe, Canada and Japan are retaliating with
restrictions of their own. Oil prices are 40 percent higher than last
year, which has spiked energy-sector returns—and stock prices—to
unsustainable levels.
All these are situations where policy change has driven a wedge between
the relative returns of different assets. A change in the income tax
rate drives a wedge between the relative value of work and of leisure.
A tariff drives a wedge between the prices of traded and untraded goods.
The wedge is the temperature differential from thermodynamics—a
disequilibrium. Wherever you find it, arbitrageurs and economic change
are close behind.
|
