Summary: We know a lot more today than we did three months ago. We know the occupants of the White House and Congress. We know which policies are likely to become law; and we know roughly when we will be able to go back to work and travel again. But there is still a lot we don’t know including when valuations will return to more normal levels. In this piece I will lay out the implications of what we know and what we don’t know for the economy and financial markets and discuss a two-part investment strategy to help investors protect capital from near-term valuation risk and take advantage of opportunities to acquire prime assets at discount prices once government support policies have ended.
I chose this title for two reasons. First, we all know the words to Johnny Nash’s 1972 anthem to optimism that has been recorded by literally everybody in the music business, from Jimmy Cliff and Bob Marley to Ray Charles, Holly Cole, and the Gospel Gangstas. Second, because after the past year, I feel like we deserve “a bright, bright, sun-shiny day”. Apologies to Johnny Nash for my alteration of his title—forty years of forecasting the economy have taught me that humility is always a good idea.
Things We Know
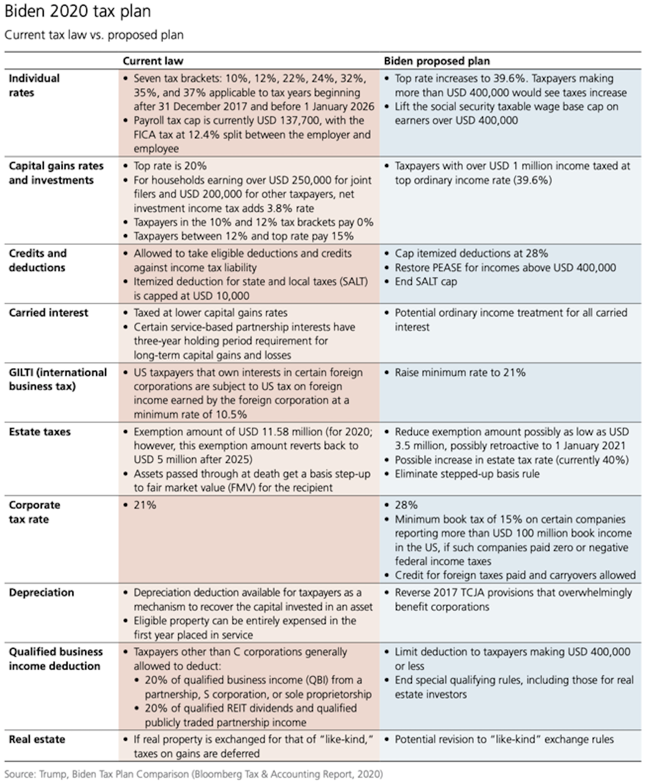
We may not be able to see all obstacles in our way, but we know a lot more now than we did three months ago when I was whining about driving in the fog. We know the names of the President, the Vice President, the Senate Majority Leader, the Speaker of the House, and most of the cabinet members. We know the government is going to spend another two trillion dollars over the next few months to support the economy. We know that tax rates on investment income are going to go up, up, up. And we know that the Fed is going to keep printing its brains out for the foreseeable future and never, ever raise interest rates again. (#sarcasm)
We know there are vaccines that are highly effective against the COVID-19 virus and have already jabbed them in more than 60 million arms. Disclosure: I got my first jab of the Moderna vaccine along with 5000 of my closest friends in the Disneyland parking lot (I parked in section Goofy-17) and the second one last week. With U.S. vaccinations now averaging 2 million per day, and the Johnson & Johnson vaccine now in the lineup, we can now see the path back to an economy running at full (although diminished) capacity again. Heck, we even know a little more about Brexit.
We know that U.S. politics are still going to be ugly. House managers presented a damning case against ex-President Trump. Senate Republicans were divided between those (7 of them) who were appalled by the January 6 insurrection on Capitol Hill and those (43 of them) who were appalled by the prospect of not getting any of the money that former President Trump raised on his way out the door.
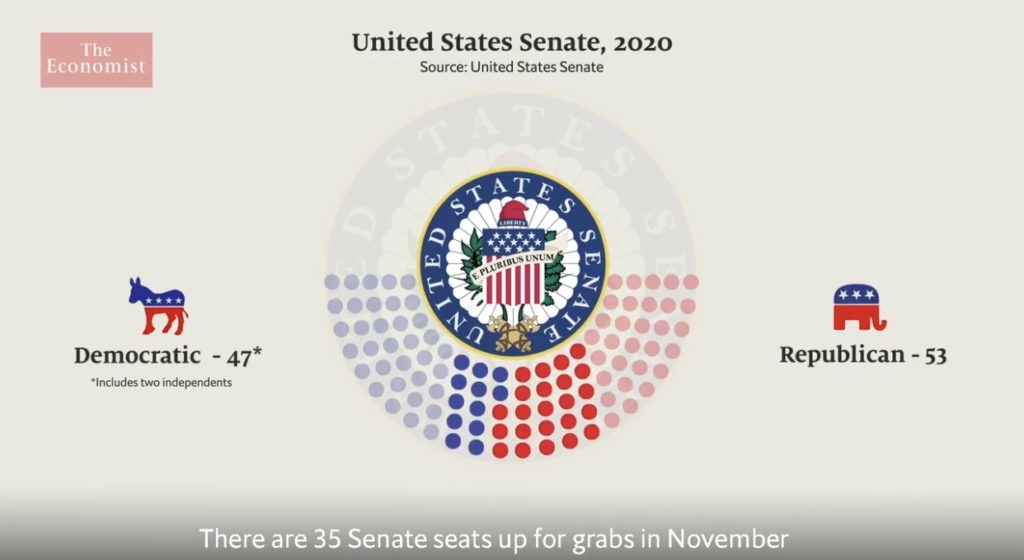
Regarding policy, the Democrats control the Senate, but only barely by counting on Vice President Harris as a tie breaker, which means many of President Biden’s proposed policies will be shrunk a size or two before they become law. Investors, who don’t like radical change, find that to be a satisfactory situation.
We know that it will take a number of years for the economy to fully recover from the pandemic. Government support programs certainly cushioned the impact of COVID-19 on the economy. Fiscal measures were so huge that average household income between last March, when the lockdown started, and the end of the year was higher than it was during the same months a year earlier. Last month, thanks to $600 stimulus checks, payments form the government made up an astonishing 30% of household income. Next month, when the $1400 checks are mailed, it will be higher than that. Perhaps surprisingly, households stuck most of that extra money in the bank, which gives them a mountain of cash to spend when they feel comfortable again.
The support programs didn’t protect everybody. Even after an impressive recovery, there are still 10 million people–largely in lower-income jobs in food service, hospitality, and travel–who have lost their jobs as a result of the pandemic, more than there were altogether at the pit of the 2008 Global Financial Crisis.
Most of these people will find their way back to work once vaccinations have proceeded and the virus has been largely contained. During this period all of the reported measures of economic performance–GDP, revenues, earnings and cash flow–will show very high growth rates by historical standards. But don’t be fooled. GDP will still be below the level it would have been had there not been a pandemic, both because a great deal of capital spending and resulting productivity improvements did not happen during the crisis and because many thousands of smaller companies went out of business during the pandemic. It will take at least 3-5 years to grow back another population of small businesses to take their place.
This forces us to admit that the extraordinary gains in stock prices over the past year were almost entirely the result of the unprecedented monetary stimulus by the Fed and other central banks that pushed interest rates to zero. If interest rates were at pre-pandemic levels today, then stock prices would be below pre-pandemic levels, which would more than erase the extraordinary gains in stock prices over the past year. This means a bet that stock valuations will remain at today’s inflated levels is a bet on a single point, that the Fed will hold interest rates at zero for literally decades to come. The spike in government bond yields over the past week shows that some investors are betting they won’t.
For purposes of assessing the cost of capital sensitivity of stock prices, we should think of the S&P 500 as a 50-year zero coupon bond. That makes stock prices exquisitely sensitive to even the slightest change in interest rates, as we saw last week when bond yields spiked higher. The duration, or time-weighted average maturity of free cash flow of the S&P 500 companies is more than 50 years, longer than the maturity of the longest Treasury bond. The duration of unprofitable, high-growth companies is even higher than that. A bet that valuations will continue to rise from today’s exalted levels will only pay off if the Fed pushes rates still lower for the foreseeable future–tough to do when rates are close to zero already. History suggests that is unlikely to happen.
When interest rates rise one day, as they must, the stock market will go through a significant correction. I believe that is likely to happen later this year when government support payments end, households and businesses are once again required to make rent, mortgage, auto loan, credit card and student loan payments, and lenders are once again required to report bad loans and can enforce loan contracts. When that happens, we will see a sharp increase in distress sales that will create opportunities to buy prime assets at deep discounts. That is when I want to be a buyer.
Recent bizarre activity in financial markets suggests the stock market correction could come sooner rather than later. The tsunami of more than 10 million inexperienced retail investors with no experience managing risk who entered the market over the past year has been playing havoc with stock prices. We have seen spikes in IPOs, SPAC issues, options trading, and volatility. More recently, flash mobs of apparently angry millennials have waged war on short traders.
As I have written before, the analytical framework behind our investment strategy (Rutledge, 2015) is based upon recent advances in physics known as Complex Adaptive Systems (Mitchell, 2011). In the scientific literature on complex systems (Prigogine, 1996), strange events like those I mentioned above are statistical markers of an impending phase transition (Solé, 2011; Sornette, 2003). You can think of a phase transition as an avalanche, earthquake, tsunami, or hurricane that produces sudden, violent change (Bak, 1996). In our framework, a financial crisis is a phase transition from a state of general equilibrium to a failed-network state caused by a sudden collapse of financial markets known as a cascading network failure. (Barabasi, 2002)
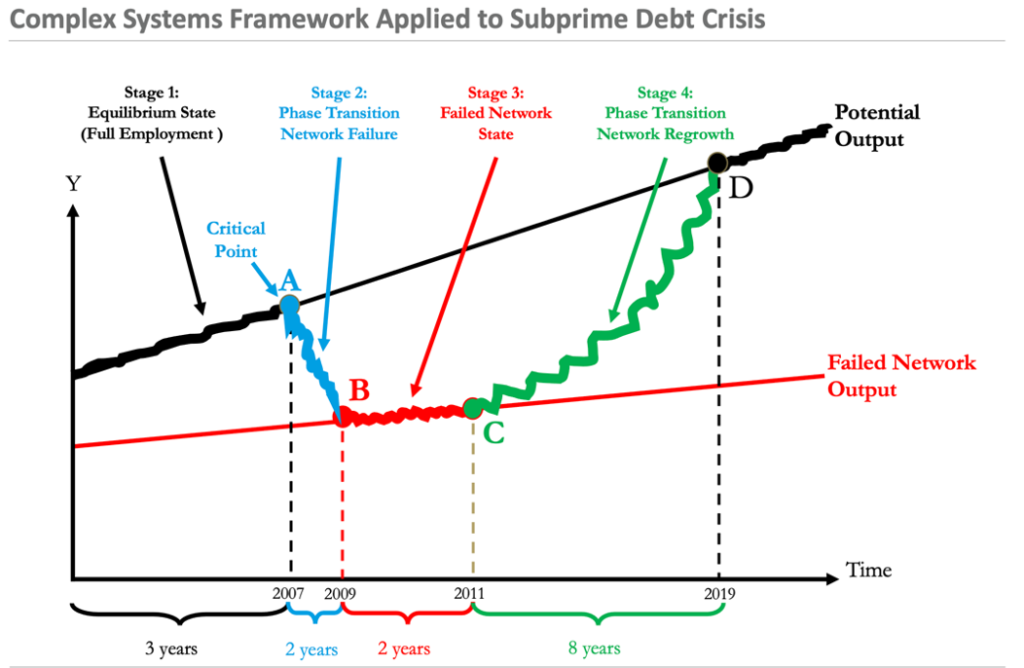
The graphic, above, illustrates our approach applied to financial markets applied to the Subprime Debt Crisis. After operating for some period at full employment (the black segment to the left of point A), financial markets experience a phase transition, the sudden seizure of activity known as a cascading network failure in the network theory literature. In both nature and financial markets, phase transitions (the blue segment A-B in the graphic) tend to be short and violent, followed by a period (the red segment B-C) when the economy appears to be stuck in recession, before the financial system experiences an extended period of slow, steady network regrowth (the green segment C-D) that ultimately returns the system to its most efficient state of full employment or potential output. For more detail on both the theoretical underpinnings of this approach and the statistical markers for financial crisis I refer the reader to a more technical companion piece. (Rutledge, 2021a).
What Should Investors do at this point?
An investor’s most important job today is to contain risk by protecting capital from loss during a sudden drop in valuations so he/she will have the liquid firepower to take advantage of opportunities to buy prime assets at discount prices when they are available.
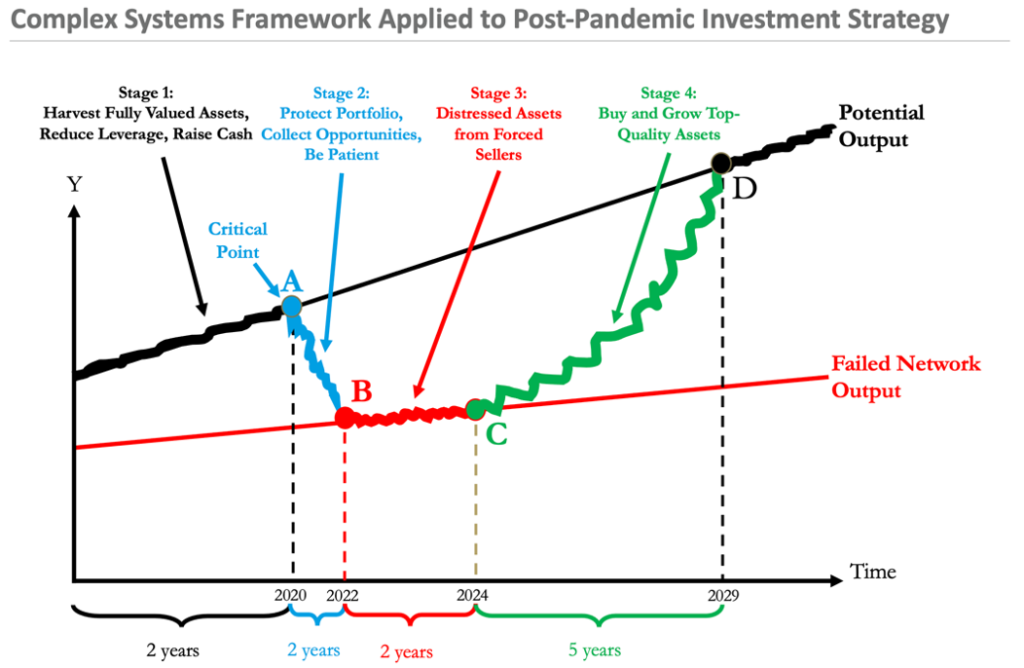
I have applied our analytical framework to the current, COVID-driven, economic crisis in the graphic above using the subprime debt crisis as a rough guide to how long we might expect each of the stages to last once COVID-19 is behind us. First, I believe the financial markets are ripe for a phase transition that is likely to take place this year. Investors who have conserved cash and reduced leverage will find great opportunities in distressed assets through 2022, followed by an extended period of growth in both performance and valuations of prime assets as financial markets recover.
Our work shows that the most interesting opportunities will be in commercial real estate, not in the stock market. Both the risk of higher inflation and the likelihood of higher tax rates will incentivize investors to shift portfolio allocations away from long-duration financial assets towards property and other real assets. The real assets offering the most generous discounts are likely to be urban real estate.
Urban Real Estate
Within real estate, we believe there will be an especially interesting opportunity in urban properties, the eye of the COVID-19 pandemic hurricane. Many today believe that the migration from the city to the suburbs we witnessed during the COVID-19 pandemic is irreversible. We believe they are wrong for both historical and economic reasons.
The history of plagues and pandemics far more serious than COVID-19 has been well-documented (Koyama, 2019; Snowden, 2019). Examples include:
- the Plague of Athens in 430 BC,
- the Plague of Justinian in 541 AD that killed 25 million people,
- the Black Death of 1347 AD that killed half of Europe’s population, described by Boccaccio (1921) in Decameron,
- the Great Plague of London (1665 AD) that drove Isaac Newton from Cambridge to the countryside where he kept himself busy inventing differential calculus and the theory of optics and formulating the law of gravity,
- and the Spanish flu of 1918 that infected over one third of the world’s population and killed 25-50 million people.
In each case, frightened people migrated from the city to the countryside for the duration of the pandemic. But the historical evidence is overwhelming. In each case they came back to the city in greater numbers than before.
There are many reasons why people always come back to the city but foremost among them is that people in cities are simply more productive. Density breeds productive and creative activity. That’s why 80% of Americans live in urban areas today and, according to United Nations projections, 80% of the people in the entire world will live in urban areas by the year 2050 (UN-Habitat, 2020).
There is overwhelming scientific evidence showing economies of scale in urbanization. For reasons detailed in my companion article reviewing both the economics and scientific academic literatures on urbanization (Rutledge, 2021b), doubling the population of a city increases per capita household income, productivity, net worth, and creative activity by about 15% (Kempes, 2020). That 15% productivity advantage is true for all cities, in all countries, in all time periods where there is adequate data (Bettencourt, 2010). The productivity advantage can be viewed as a gravitational force that pulls the most energetic and creative people to live and work in urban areas.
Once fear of COVID-19 has subsided, they will be back (Florida, 2020). When they do, I would like to welcome them to the urban properties we will acquire during the post-pandemic fire sale as their new landlord. Of course, full recovery of cities, like full recovery of the economy, will take time so it is important to be cautious in projections, modest in leverage, and disciplined in price.
JR
Selected References
Bak, P. (1996). How Nature Works: The Science of Self-Organized Criticality. New York: Springer Verlag.
Barabasi, A.-L. (2002). Linked: How Everything Is Connected to Everything Else andWhat It Means. New York: Perseus Publishing
Bettencourt, L. W., Geoffrey. (2010). A Unified Theory of Urban Development. Nature, 467, 912-913.
Boccaccio, G. (1921). The Decameron (M. Rigg, Trans.). London: David Campbell.
Florida, R. (2020). This Is Not the End of Cities. Bloomberg CityLab. Retrieved from https://www.bloomberg.com/news/features/2020-06-19/cities-will-survive-pandemics-and-protests?sref=oolPz7y9
Kempes, C. W., Geoffrey. (2020). The Simplicity and Complexity of Cities. The Bridge: Linking Engineeering and Society, 50(4).
Koyama, M. J., R.; Johnson, N. (2019). Pandemics, Plagues, and Populations: Evidence From the Black Death. Discussion Papers, (13523). London.
Mitchell, M. (2011). Complexity: A Guided Tour. Oxford: Oxford University Press.
Prigogine, I. (1996). The End of Certainty. New York: The Free Press.
Rutledge, J. (2015). Economics as energy framework: Complexity, turbulence, financial crises, and protectionism. Review of Financial Economics. Retrieved from http://dx.doi.org/10.1016/j.rfe.2015.02.003
Rutledge, J. (2021a, 2/15/21). Far-From-Equilibrium Economics and Finance.
Rutledge, J. (2021b, 2/15/21). The Impact of COVID-19 on Urbanization.
Snowden, F. M. (2019). Epidemics and Society: From the Black Death to the Present. New Haven: Yale University Press.
Solé, R. V. (2011). Phase Transitions. Princeton: Princeton University Press.
Sornette, D. (2003). Critical Market Crashes. 378(1), 1–98. doi:10.1016/S0370-1573(02)00634-8
UN-Habitat. (2020). World Cities Report 2020. The Value of Sustainable Urbanization. Retrieved from https://unhabitat.org/sites/default/files/2020/10/wcr_2020_report.pdf